Solar Panel Savings Calculator Guide
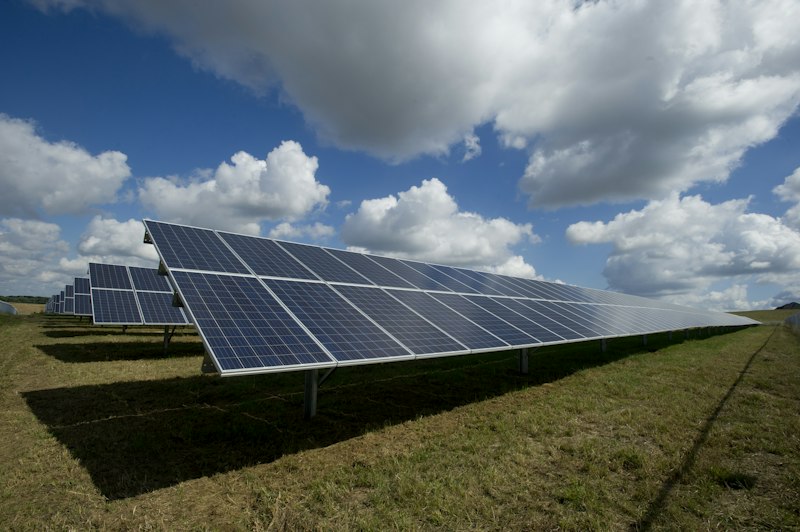
Solar panel installation is one of the most impactful home improvements you can make, both for reducing your carbon footprint and for saving thousands of dollars on electricity bills over the long term. With the federal solar Investment Tax Credit at 30% through 2032 and electricity rates rising 3-5% annually, the financial case for solar has never been stronger. Our Solar Panel Savings Calculator helps you estimate your potential savings, payback period, and 25-year net return based on your specific circumstances.
Understanding Solar Panel System Costs
The total installed cost of a residential solar system ranges from $15,000 to $30,000 before tax credits, or approximately $2.80-3.20 per watt. A typical 7 kW system costs approximately $21,000 before incentives. The 30% federal tax credit reduces this to $14,700. Many states offer additional incentives — for example, New York offers a 25% state tax credit up to $5,000, and California has net energy metering that allows homeowners to sell excess electricity back to the grid. Solar panel prices have dropped over 70% in the last decade, making home solar more accessible than ever. Modern solar panels come with 25-year performance warranties and are expected to last 30+ years with only modest efficiency degradation of approximately 0.5% per year.
How Solar Panels Save You Money
Solar panels generate electricity during daylight hours when your home typically uses the most power and when electricity rates are highest. Net metering programs in most states allow you to export excess electricity to the grid and receive credits that offset the electricity you use at night or during cloudy periods. A properly sized solar system can reduce your electricity bill by 70-100% depending on your location and usage patterns. The average solar homeowner saves $1,200-2,400 per year on electricity costs. Over 25 years — the typical warranty period — total savings range from $30,000-60,000 after factoring in system cost and electricity inflation. Solar also increases home value by approximately 4% or $15,000-20,000 for a typical installation, according to studies from Zillow and the Lawrence Berkeley National Laboratory.
Choosing the Right Solar Installer and Financing
Getting quotes from at least three licensed, insured solar installers is essential for finding the best price and quality. Check reviews on EnergySage, Google, and the Better Business Bureau. Compare the cost per watt, equipment brands (quality varies significantly between manufacturers), warranty terms, and projected annual production. Financing options include cash purchase (best long-term return), solar loans with 10-20 year terms and 4-8% interest rates, solar leases (no upfront cost but lower savings), and Power Purchase Agreements where you pay a fixed rate for the electricity generated. Cash or loan purchases allow you to claim the 30% federal tax credit, while leases and PPAs transfer the credit to the installer. Most homeowners choose solar loans as the best balance of affordability and savings.
Worked Example: Running the Math on a 7 kW System
Let's trace exactly what happens when you enter a $150 monthly electric bill, moderate sunlight (4.5 peak hours), a 7 kW system, the 30% federal tax credit, and a $3.00 per watt installed cost into the calculator.
System cost comes first. The calculator converts the system size from kilowatts to watts by multiplying by 1,000, then multiplies by the cost per watt: 7,000 × $3.00 = $21,000 gross. Applying the 30% credit gives $6,300 of tax savings, so your net out-of-pocket cost is $14,700. This net figure is what the payback calculation starts from.
Annual production is estimated as system size × peak sunlight hours × 365 days × a 0.75 derating factor that accounts for panel losses, shading, inverter efficiency, and seasonal variation. For this example: 7 × 4.5 × 365 × 0.75 = about 8,623 kWh per year. The calculator then derives an implied electricity rate from your annual bill ($1,800) divided by roughly 1.1x that production, which lands near $0.19 per kWh here, and it caps annual savings at 90% of your current bill so the estimate stays conservative. That produces about $1,555 in annual savings.
Payback period is net cost divided by annual savings: $14,700 ÷ $1,555 = 9.5 years. The tool displays this as "9.5 years" in the results. Finally, the 25-year figure compounds the annual savings at 3% per year to reflect electricity price inflation, summing roughly $56,700 of cumulative savings before subtracting the $14,700 net cost, for a net 25-year result near $42,000.
That last number is the headline to focus on. Even if real production lands 10% below the estimate, the 25-year outcome still clears $30,000 for a median US scenario. Run the same inputs with a $250 monthly bill and 5.5 peak hours and the payback drops toward 6-7 years, which shows how quickly the case improves in high-rate, high-sun areas.
Related Calculators
Track your current energy usage with the Electricity Cost Calculator. Evaluate the overall return on your solar investment with our ROI Calculator. Plan your solar project budget with the Budget Calculator.
Keywords: solar panel calculator, solar savings calculator, solar cost estimator, solar ROI calculator, solar payback period, home solar panels, solar installation cost, federal solar tax credit, solar energy savings, solar panel payback, how much do solar panels save
Written by the CalcMaster Pro Editorial Team — financial, health, and DIY tools reviewed for accuracy. All calculators run on standard, widely accepted formulas. Always confirm final numbers with a qualified professional for decisions that require official figures.